

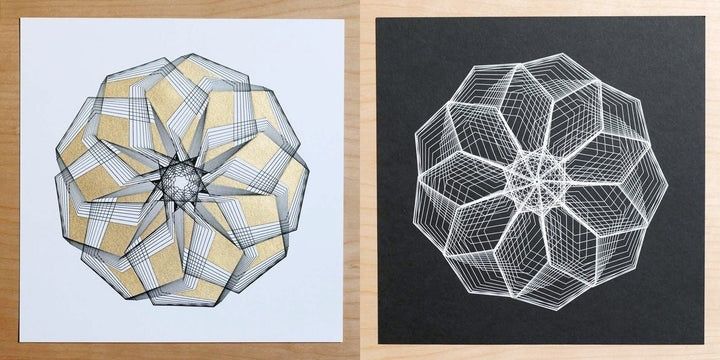
The Physical Awakening of Pure Code
Generative art has become remarkably easy to produce, reproduce, and distribute. A few lines of code can generate thousands of compositions, while a screen can display them with perfect alignment, unlimited colour control, and no visible trace of the process that made them. That convenience is also the source of a growing fatigue among computational artists. A digital image can be conceptually rich yet physically absent, experienced as a temporary arrangement of light rather than as an object with weight, surface, and resistance.
Pen plotting offers a practical answer to that absence. A drawing machine turns coordinates into movement, movement into pressure, and pressure into a line that exists on a particular sheet of paper. The result is not simply a screen image transferred to another medium. Ink spreads, fibres catch pigment, motors hesitate, and a pen may leave a slightly different trace on every pass. For artists exploring physical vector workflows, the central shift is from mathematical perfection to material negotiation. The algorithm remains essential, but the final work is shaped by forces the code cannot fully command.
Historic Roots and the Evolution of Algorithmic Drawing
Pen plotters began as technical instruments rather than art machines. From the late 1950s onward, engineers, architects, and scientific institutions used them to produce blueprints, circuit diagrams, and other precise documents. Their operating principle was direct and consequential: instead of describing a bitmap as a grid of coloured pixels, the system instructed a pen to travel through coordinates. That made the machine particularly suitable for early computer artists, who could treat the plotted line as a primary artistic mark rather than as a reproduction of an image made elsewhere.
During the 1960s, artists and technically trained practitioners such as Vera Molnar, Frieder Nake, Georg Nees, Manfred Mohr, and A. Michael Noll began using algorithms to explore order, variation, geometry, and controlled randomness. Their work was produced under conditions that now seem extremely restrictive. There were no modern visual interfaces, instant previews, or inexpensive processors. Punch cards, magnetic tape, mainframe systems, cathode-ray displays, and mechanical plotters formed part of the working environment. In many cases, the plotted paper was the first moment at which an algorithm became visibly inspectable.
This history matters because it places physical output at the centre of computational art, not at its edge. The machine was not merely a printer waiting for a finished digital picture. It was an active participant in the translation from rule to mark. Curatorial accounts of the field, including the V&A history of collecting digital objects, show why hardware, software, documentation, and physical artefacts must be considered together. Contemporary desktop plotters are smaller, cheaper, and easier to control, but they continue the same basic conversation between instruction and mechanism.
Screen Coordinates Versus Physical Reality
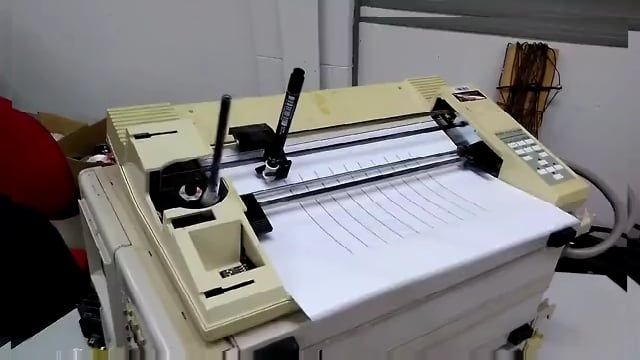
A screen rendering and a plotted drawing may share the same coordinate system, yet they do not share the same behaviour. A raster image resolves into pixels and can be displayed with exact repetition as long as the file and display conditions remain unchanged. A vector plotter follows paths through physical space. The line depends on the machine”s acceleration, belt tension, pen geometry, paper position, and the interaction between ink and surface. A useful technical overview of the classic mechanical plotter architecture makes this distinction clear: the machine translates coordinate paths into continuous motion across a plotting bed rather than mapping a finished bitmap.
| Screen rendering | Physical vector execution |
|---|---|
| Pixel-based display with highly predictable edges | Continuous paths affected by mechanics and materials |
| Easy to undo, duplicate, scale, and recolour | Requires setup, calibration, drying time, and handling |
| Usually judged by visual fidelity to the file | Judged by both the intended structure and material variation |
| Errors are generally software or display errors | Errors may arise from backlash, friction, slipping, or ink flow |
Mechanical backlash is the small amount of play that can occur when a motion system changes direction. Motor step limits can restrict how finely a machine responds, while friction can slow or redirect a pen on textured paper. These effects do not necessarily destroy deterministic code. They expose the difference between deterministic instructions and non-deterministic execution. A line that is mathematically identical to ten previous lines may appear darker, lighter, rougher, or slightly displaced because the physical conditions have changed.
The Chemistry of Materials in Plotter Workflows
Paper should be treated as an algorithmic variable, not as a neutral container. Weight affects how securely a sheet sits on the bed and how much moisture it can absorb. Tooth, meaning the texture of the surface, influences drag and the continuity of a stroke. A smooth coated sheet may preserve a fine line but resist certain inks, while an uncoated sheet may accept pigment readily and produce softer, wider marks. Capillary action pulls liquid into the paper fibres, turning ink density and drying time into part of the visual system.
Pen selection changes the expressive vocabulary of the same path. Fineliners are useful for controlled, repeatable lines and dense hatching. Fountain nibs can create more character through ink flow and directional pressure, although they may require careful adjustment of speed and reservoir behaviour. Brush pens or flexible nibs introduce changing stroke widths, especially when the plotter has a sufficiently capable lift or pressure mechanism. Research into modified plotter mechanisms has shown that finer control over pen height can support variable line weight and more ambitious brush-based experiments.
Unexpected phenomena should be recorded rather than dismissed. Pooling can occur when a path slows at a corner or when several strokes overlap before the ink has dried. Bleeding depends on paper sizing, ink viscosity, and the amount deposited. Surface drag may cause a nib to skip, catch, or rotate slightly. A practical test sheet is therefore more valuable than a single “perfect” setup. Plot short lines, tight curves, crosshatches, and filled regions at different speeds, then note drying time, edge sharpness, and visible accumulation.
- Use heavier paper when the work contains dense ink coverage or repeated passes.
- Test every pen and ink combination on the actual paper stock, not only on a similar sample.
- Leave adequate drying time before lifting or stacking finished sheets.
- Record speed, nib, ink, paper, and calibration settings so successful conditions can be repeated.
Building a Resilient Generative Plotting Pipeline
A resilient workflow separates invention, preparation, and execution. Generate the composition in code first, but design it with the machine”s constraints in mind. Keep the drawing inside a measured page boundary, establish a clear coordinate convention, and preserve the random seed for every important iteration. Date-sortable filenames and saved parameter sets make it possible to compare versions without losing the relationship between code and physical outcome. This kind of discipline is especially valuable when an apparently minor change in line density produces a major change in ink behaviour.
- Generate the geometry and save the seed, parameters, and source file.
- Export vector paths, commonly as SVG, using a consistent unit system and page size.
- Inspect the file for open paths, duplicate lines, extreme coordinates, and unwanted clipping.
- Simplify excessive points while preserving the character of curves and intentional irregularities.
- Order paths to reduce unnecessary travel, grouping nearby strokes and delaying pen lifts where appropriate.
- Calibrate the pen height, lift height, origin, scale, and drawing speed on a test sheet.
- Run the final plot, monitor the first minutes, and document material conditions with the finished sheet.
Path ordering deserves particular attention. A visually correct SVG can still produce a poor physical result if the machine repeatedly crosses the page with the pen lifted or draws adjacent regions in an inefficient sequence. Sorting paths by proximity can reduce travel time and unnecessary wear, while grouping by colour or pen can make multi-stage work more predictable. Path simplification also matters: thousands of nearly redundant points may increase file size and create small mechanical hesitations without improving the visible line.
Pen-lift height is another practical control. Too low, and the nib may drag between separate marks. Too high, and the mechanism may waste time or introduce vibration when descending. Pressure is often indirect on consumer machines, so artists may need to use speed, nib flexibility, and lift height to approximate pressure variation. Begin with simple black line work, then introduce colour, layered passes, or variable stroke weight only after the basic pipeline is reliable. The goal is not to eliminate every surprise. It is to distinguish productive variation from preventable failure.
Embracing the Beautiful Friction of Tangible Code
Mechanical limitations and material artefacts enrich generative art when they are understood as part of the system. A slight shift caused by backlash can interrupt a repetitive pattern in a way that exposes its construction. A darker overlap can create an unintended focal point. A rough paper fibre can make a mathematically smooth curve feel visibly drawn. These effects are not automatically valuable, but they give the work a physical history that a perfectly repeated screen image cannot provide.
The most effective way to begin is modestly. Choose one reliable plotter, one paper stock, and one pen family. Build a calibration library, preserve every seed and parameter set, and make small studies before committing to large compositions. Inspect the result as both an image and an object: look at the line, but also the pressure, edge, smell of ink, paper curl, and evidence of movement. In a landscape saturated with digital copies, a plotted original offers something more durable than novelty. It records a specific encounter between code, machine, material, and time.